

Structured vs Unstructured Data: Everything You Need to Know About Big Data Analytics
Key Takeaways
- Businesses deal with structured, semi-structured, and unstructured data, and each type plays a different role in analytics and decision-making.
- Structured data is easy to store and analyze, but unstructured data carries most of the real-world context from emails, images, videos, and conversations.
- Combining different data types helps organizations move from basic reporting to deeper, context-driven insights.
- Modern analytics depends on AI, machine learning, and scalable data platforms to process large and diverse datasets effectively.
- Companies that unify their data strategy can improve forecasting, customer understanding, and overall business performance.
Introduction
Businesses collect data from many different sources, from transactions and websites to customer emails, social media, sensors, and images. However, this information is often scattered across different systems and formats. The challenge is not just collecting data anymore, but making sense of it in a way that helps businesses make quicker and better decisions, especially with the growing role of big data analytics in modern enterprises.
For years, businesses mainly relied on structured data stored in databases and spreadsheets. But that represents only a small share of the data available today. According to research published on ResearchGate, unstructured data now makes up nearly 80% to 90% of all data and is growing three times faster than structured data. This includes emails, PDFs, videos, customer reviews, call recordings, and social media posts that often contain valuable business insights
In this blog, we will break down the differences between structured, semi-structured, and unstructured data, explore real-world business examples across industries, and discuss practical ways organizations can start integrating these data sources for smarter analytics.

What is Structured Data
Structured data is information organized in a clear, well-defined way, making it easy for both people and systems to read, store, and process.
| According to IBM, structured data refers to information organized in a fixed format, usually within rows and columns in databases or spreadsheets. Since the data follows a consistent structure, it is easier to store, search, manage, and analyze. |
Structured data is usually stored in databases where information is arranged into fixed fields and categories. Since the data is arranged in predefined fields, businesses can easily search, manage, and analyze it for reporting, analytics, and daily operations.
Core Characteristics of Structured Data
Structured data is organized in a set format, which makes it easier to work with and analyze. Some of its common characteristics include:
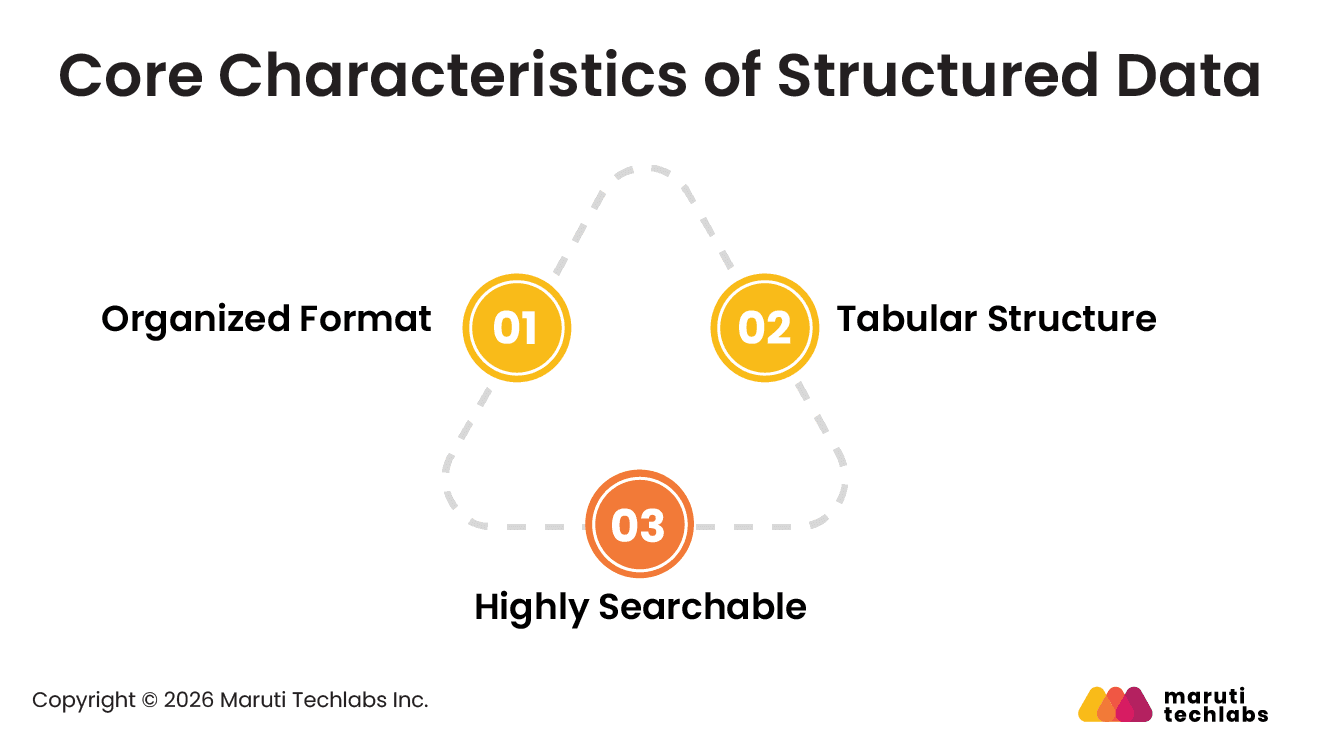
- Organized Format: Data fits into predefined schemas or data models with clearly defined fields.
- Tabular Structure: Information is stored in rows and columns, making it easy to sort, filter, and manage.
- Highly Searchable: Data can be quickly queried and analyzed using languages like SQL.
Common Sources of Structured Data
Structured data is generated and stored across many business systems and applications. Common sources include:
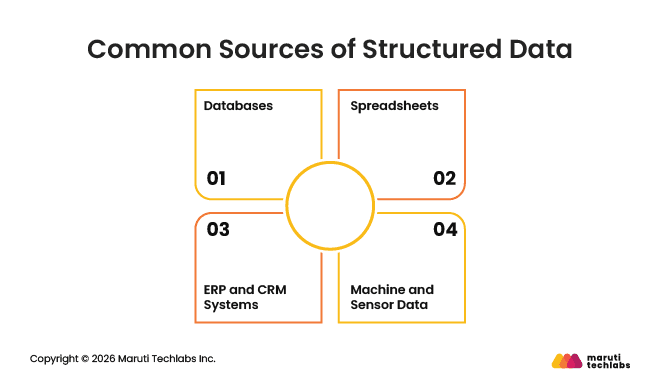
- Databases: Systems such as MySQL, PostgreSQL, and Oracle store customer, sales, and operational records.
- Spreadsheets: Excel and Google Sheets are commonly used to store financial, operational, and business data in tables.
- ERP and CRM Systems: These systems store customer details, invoices, sales records, and inventory data.
- Machine and Sensor Data: Includes server logs, POS transactions, and sensor readings collected from devices and applications.
Structured Data Examples in Business
Structured data is used across many day-to-day business operations for reporting and decision-making. Some common examples include:
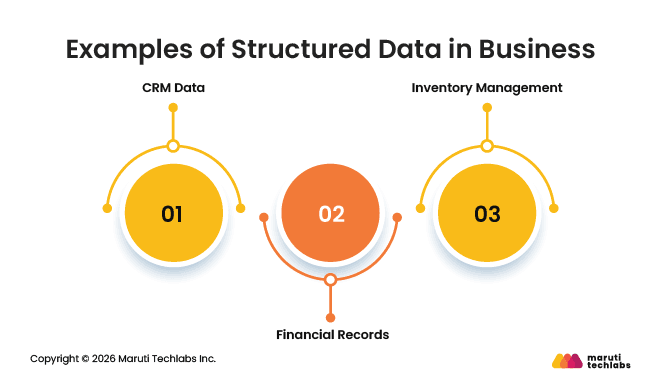
- CRM Data: Customer names, contact details, purchase history, and lead information stored in structured fields.
- Financial Records: Invoices, payments, and accounting data used for reporting and compliance.
- Inventory Management: Product IDs, stock levels, and reorder details tracked for supply chain and inventory planning.
Tools and Techniques Used with Structured Data
To work with structured data, businesses often use a mix of database and analytics tools. Some common ones are:
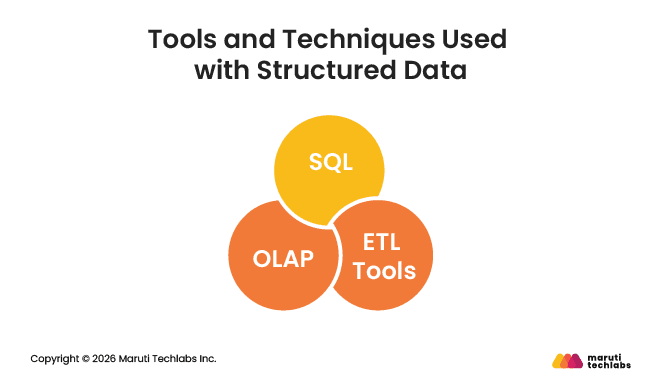
- SQL: Used to access and work with data stored in databases.
- OLAP: Helps teams analyze data from different angles for reports and dashboards.
- ETL Tools: Tools like Talend and Informatica are used to collect, clean, and move data between systems.
Limitations of Structured Data
While structured data is highly efficient for analysis, it also has some limitations:
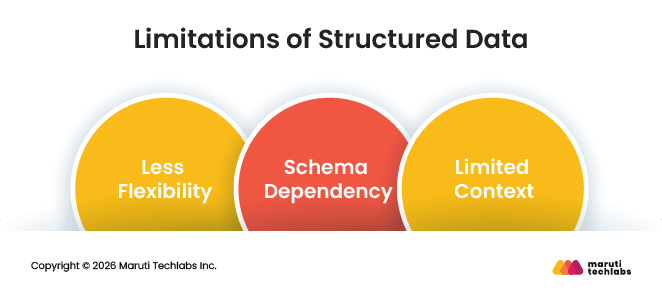
- Less Flexibility: It is not well-suited for storing text, images, videos, or other unstructured content.
- Schema Dependency: Making changes to the data structure often requires redesigning databases and workflows.
- Limited Context: Structured data alone may not provide deeper insights without combining it with unstructured data sources.
What is Unstructured Data
Unstructured data is information that comes in different forms and does not follow a fixed structure, which makes it harder to store and manage in traditional databases.
| According to Forbes, unstructured data refers to information that cannot be easily stored in traditional tables, spreadsheets, or row-and-column databases. This type of data is growing by nearly 55% to 65% every year. |
Unlike structured data stored in rows and columns, unstructured data does not have a fixed format. Common unstructured data examples include emails, chat messages, PDFs, images, videos, audio files, social media posts, and other types of free-form content.
Since this data is not organized in a consistent way, it is harder to search, manage, and analyze using traditional systems. Businesses often use AI, machine learning, and unstructured data analytics tools to make sense of this information and find useful insights from it.
Why Unstructured Data Matters
Unstructured data matters because it helps businesses understand customer behavior, feedback, and business activities beyond structured records. Some of the main benefits include:
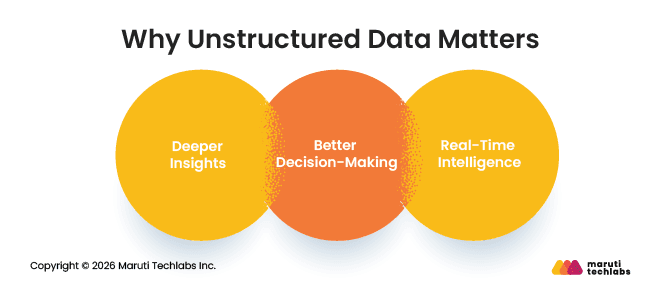
- Deeper Insights: Helps businesses understand customer opinions, preferences, and behavior from reviews, conversations, and online content.
- Better Decision-Making: Gives more context for things like personalization, fraud detection, and predictive analysis.
- Real-Time Intelligence: Helps businesses monitor customer feedback, social media activity, and operational updates more quickly.
Common Sources of Unstructured Data
Unstructured data comes from many everyday business activities and digital interactions. Some common unstructured data examples include:
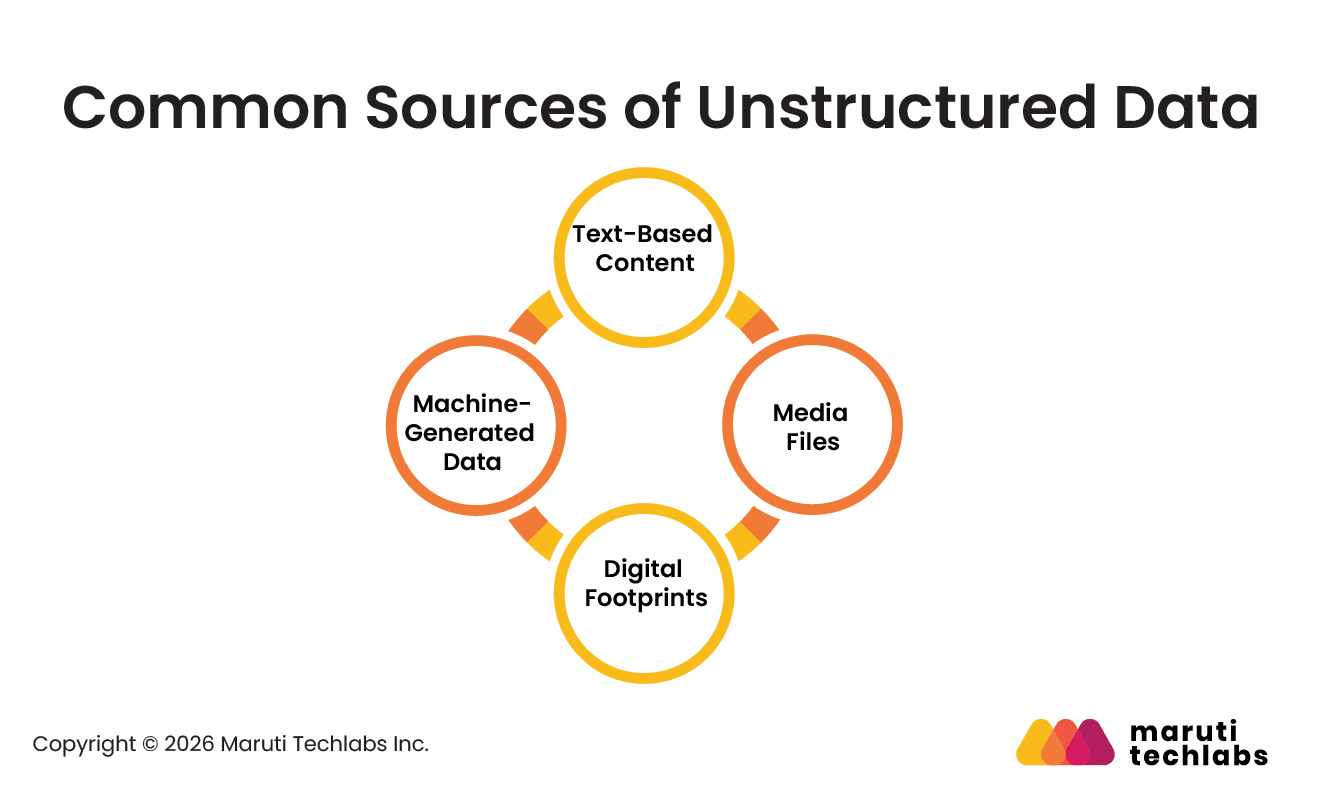
- Text-Based Content: Emails, chat messages, PDFs, documents, and customer support tickets.
- Media Files: Audio recordings, images, photos, and video files.
- Digital Footprints: Social media posts, online reviews, and call transcripts.
- Machine-Generated Data: Server logs, IoT sensor data, and satellite images.
Tools and Techniques Used with Unstructured Data
Businesses use different tools and techniques to process and analyze unstructured data. Some commonly used unstructured data analytics tools include:
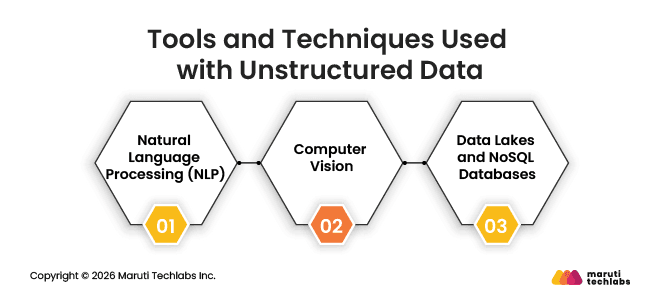
- Natural Language Processing (NLP): Helps analyze text, understand sentiment, and pull information from documents and conversations.
- Computer Vision: Used to identify and understand images and video content.
- Data Lakes and NoSQL Databases: Help store and manage large amounts of unstructured data without a fixed format.
Challenges of Unstructured Data
Working with unstructured data is not always easy because the data comes in many different formats and large volumes. Content like emails, videos, images, PDFs, social media posts, and other unstructured data examples can be difficult to organize and analyze efficiently. Some common challenges include:
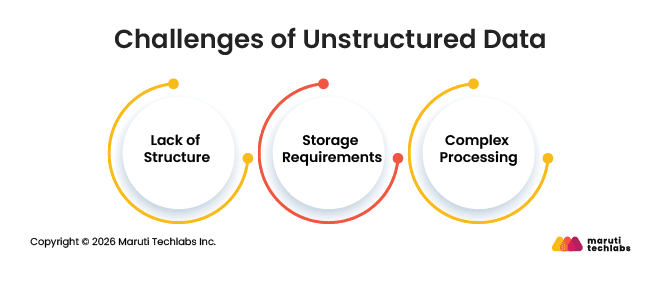
- Lack of Structure: Data like text, images, and videos is not organized in a fixed format, which makes analysis harder.
- Storage Requirements: Large media files and logs need more storage space and infrastructure.
- Complex Processing: Businesses often need AI models and advanced tools to analyze unstructured data properly.
What is Semi-Structured Data
Semi-structured data sits between structured and unstructured data. It does not follow a strict tabular format like relational databases, but it still contains labels, tags, or metadata that help organize the information.
Unlike structured data, semi-structured data does not require a fixed schema, which makes it more flexible for handling changing or complex data. At the same time, it is more organized than completely unstructured data.
Core Characteristics of Semi-Structured Data
Semi-structured data has some level of organization, but the structure can vary from one record to another. Some common characteristics include:
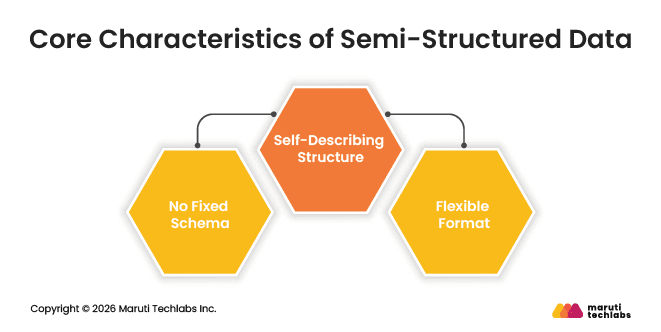
- No Fixed Schema: Data does not need predefined rows and columns.
- Self-Describing Structure: Uses tags, metadata, or key-value pairs to organize information.
- Flexible Format: Different records can contain different fields or attributes.
Common Examples of Semi-Structured Data
Semi-structured data is widely used in modern applications, APIs, and cloud systems. Some common examples include:
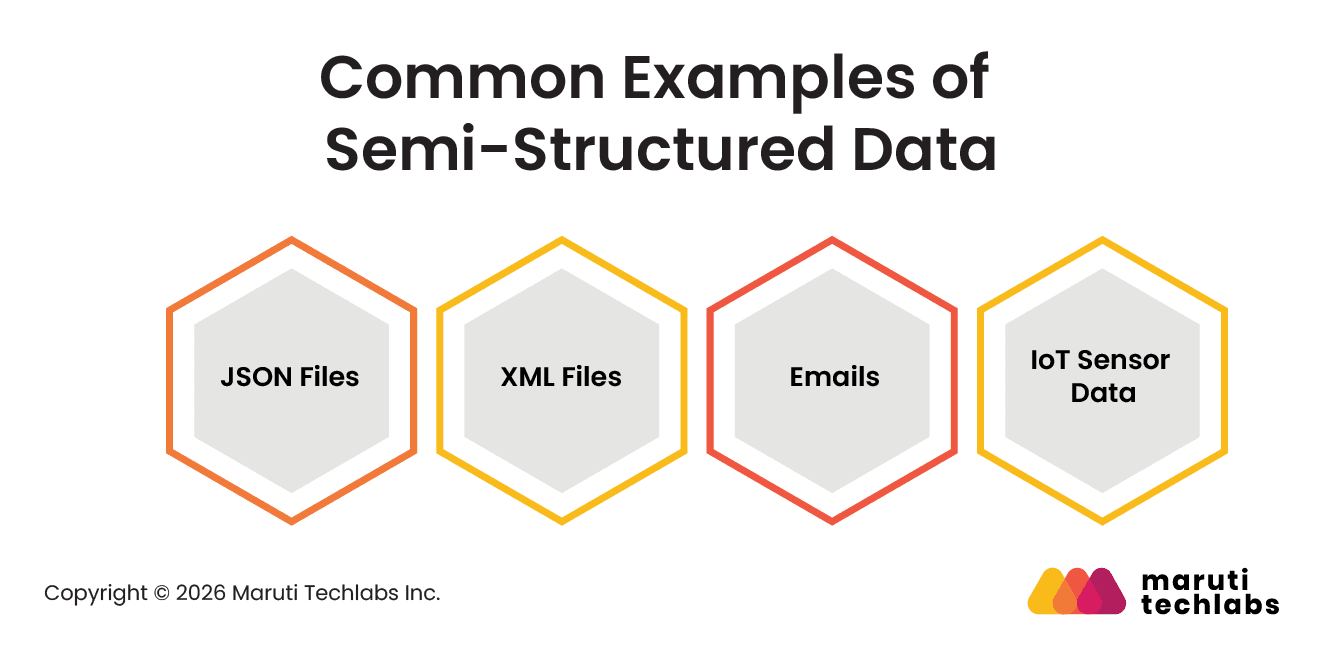
- JSON Files: Commonly used in APIs and web applications for data exchange.
- XML Files: Uses custom tags to organize and transfer data.
- Emails: Includes structured fields like sender, receiver, and subject, along with unstructured message content.
- IoT Sensor Data: Device data streams that include different metrics and status information.
Semi-Structured vs. Structured and Unstructured Data Based on Data Structure
Semi-structured data shares some structural characteristics with both structured and unstructured data.
- Structured Data: Follows a fixed format with rows and columns.
- Semi-Structured Data: Contains tags or metadata but does not follow a rigid schema.
- Unstructured Data: Has no predefined structure or format.
Why Semi-Structured Data Matters
Semi-structured data works well for modern systems where data changes frequently or comes from multiple sources. It is commonly used in cloud applications, APIs, social media platforms, and IoT systems because it offers flexibility without losing organization completely.
Businesses often store semi-structured data in NoSQL databases and modern data platforms that can handle large and dynamic datasets more efficiently.
Structured vs. Unstructured Data: The 2 Pillars of Big Data Analysis
Structured and unstructured data are handled differently because they follow different formats, storage methods, and analysis approaches. Both play an important role in big data analytics and enterprise AI systems.
Feature | Structured Data | Unstructured Data |
Format | Organized into rows and columns | Stored in free-form formats |
Schema | Fixed schema | No predefined schema |
Storage | Relational databases and data warehouses | Data lakes and NoSQL systems |
Examples | CRM records, spreadsheets, transactions | Emails, videos, PDFs, social media posts |
Analysis Tools | SQL, BI dashboards, OLAP tools | NLP, machine learning, computer vision |
Data Type | Quantitative data | Qualitative and context-rich data |
Common Use Cases | Reporting, ERP systems, operational analytics | Sentiment analysis, AI models, and personalization |
Key Differences Between Structured and Unstructured Data
Structured data vs. unstructured data is mainly about how the data is organized and processed. Although both are used in analytics, the way businesses work with them is very different:
- Organization: Structured data is highly organized, while unstructured data exists in raw formats.
- Processing: Structured data works with traditional analytics systems, whereas unstructured data often needs AI-based processing.
- Accessibility: Business users can usually work with structured data directly, while unstructured data often requires specialized tools and expertise.
- Storage Requirements: Unstructured data usually needs more storage and computing resources because of large files like videos, images, and logs.
- Business Insights: Structured data focuses on measurable business metrics, while unstructured data helps uncover context, sentiment, and user behavior.
Real-World Examples of Structured and Unstructured Data by Industry
Businesses across industries work with both structured and unstructured data every day. Structured data is organized and stored in databases, while unstructured data includes content like text, images, videos, audio, and documents that require additional processing and analysis.
1. Healthcare
- Structured Data: Patient IDs, billing records, diagnosis codes, lab results, and vital signs stored in EHR systems.
- Unstructured Data: Doctor notes, medical scans, X-rays, prescriptions, and patient intake forms.
2. Banking
Banks use structured data for financial operations and unstructured data for customer interactions, compliance, and fraud analysis.
- Structured Data: Account balances, transaction history, loan records, credit scores, and customer information.
- Unstructured Data: Customer emails, support chat logs, call recordings, and financial documents.
3. Insurance
Insurance companies combine structured and unstructured data to process claims, assess risks, and investigate fraud cases.
- Structured Data: Policy details, claim records, premium payments, and customer profiles.
- Unstructured Data: Accident photos, scanned claim forms, adjuster notes, and recorded customer statements.
4. Retail and Ecommerce
Retail businesses use different types of data to manage inventory, track customer behavior, and improve shopping experiences.
- Structured Data: POS transactions, product inventory, pricing data, and loyalty program records.
- Unstructured Data: Product reviews, social media posts, customer chats, and product videos.
5. Manufacturing and IoT
Manufacturing companies collect machine and operational data to monitor production and improve maintenance processes.
- Structured Data: Machine temperatures, production counts, work orders, and sensor readings.
- Unstructured Data: Maintenance logs, inspection images, technician notes, and voice recordings from factory floors.
How to Integrate Structured and Unstructured Data for Better Analytics
Integrating structured and unstructured data helps businesses connect operational data with real-world context. Instead of analyzing transactions, reports, or customer records separately from emails, documents, reviews, or media files, businesses can combine both to get more complete insights for analytics and decision-making.
1. Identify and Organize Data Sources
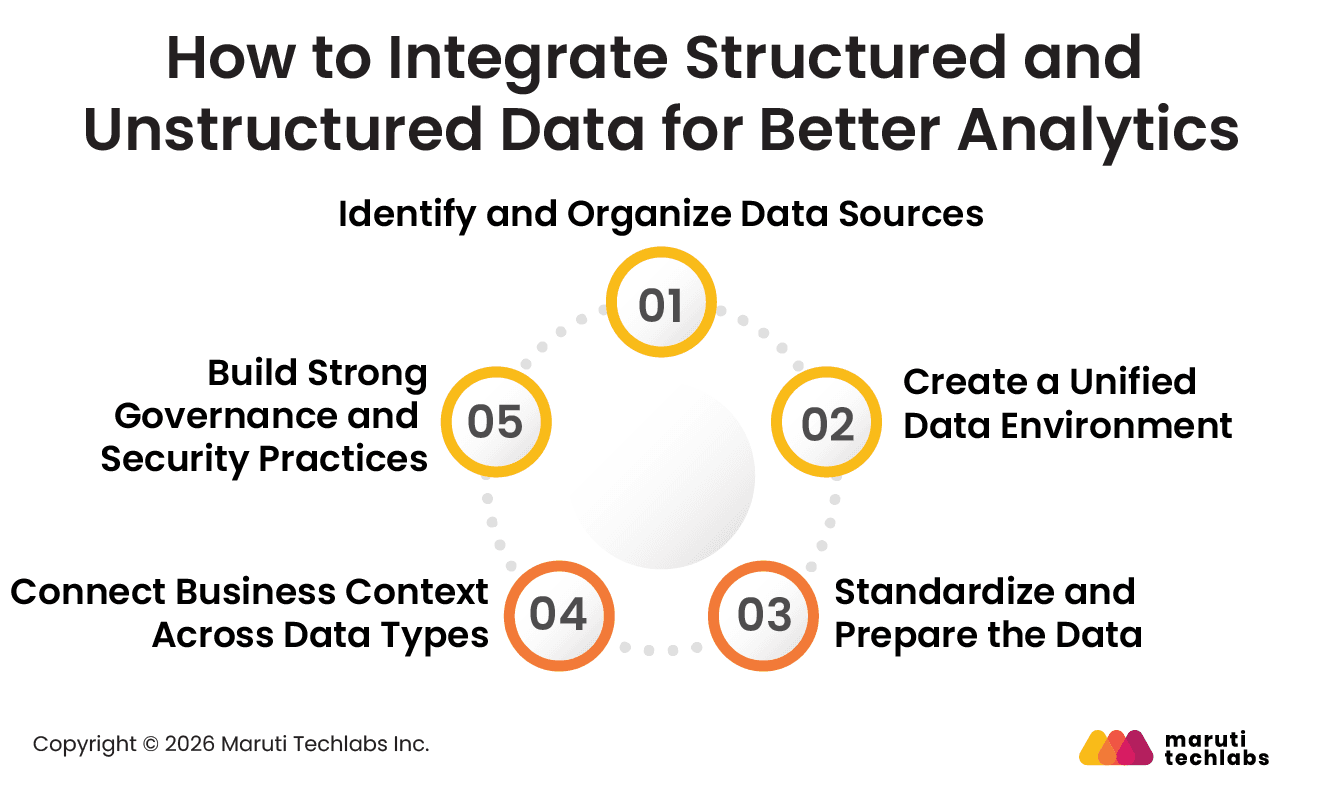
The first step is understanding where the data comes from and how it is being used across the business. Structured data usually exists in databases, ERP systems, CRM platforms, and transactional applications, while unstructured data often comes from emails, documents, support conversations, images, videos, and social platforms.
Before integration begins, businesses need to organize these data sources and define how they connect with each other.
2. Create a Unified Data Environment
Many businesses struggle because data is spread across disconnected systems and teams. Bringing different data sources into a centralized environment makes integration easier and improves accessibility for analytics teams.
Modern data architectures allow businesses to work with structured, semi-structured, and unstructured data together without forcing everything into a rigid format. This also helps reduce data silos across departments.
3. Standardize and Prepare the Data
Different data sources often use inconsistent formats, naming conventions, and structures. Before analysis, businesses need to clean, categorize, and standardize the data so it can be used together more effectively.
This step may include removing duplicate records, organizing document formats, mapping identifiers across systems, and improving overall data quality.
4. Connect Business Context Across Data Types
The main goal of integration is to connect operational metrics with real customer, operational, or market context. Businesses can combine customer records with reviews, support interactions, or engagement data to understand trends more clearly.
This helps teams move beyond isolated reporting and build more context-driven analytics and decision-making processes.
5. Build Strong Governance and Security Practices
As businesses combine more data sources, effective governance practices become more important. Organizations need clear policies for data access, privacy, compliance, and ownership across all systems.
Maintaining proper governance also helps improve data quality, reduce risks, and ensure that analytics systems work with reliable and secure information.
Choosing the Right Approach for Big Data Analytics
The right big data analytics approach depends on the type of data a business works with, the problems it wants to solve, and the tools or resources available. There is no single solution that works for every business, so the approach usually depends on business goals, data volume, and analytics needs. In many cases, simplifying big data analytics with Elasticsearch or similar search-based systems helps teams quickly query and make sense of large, complex datasets.
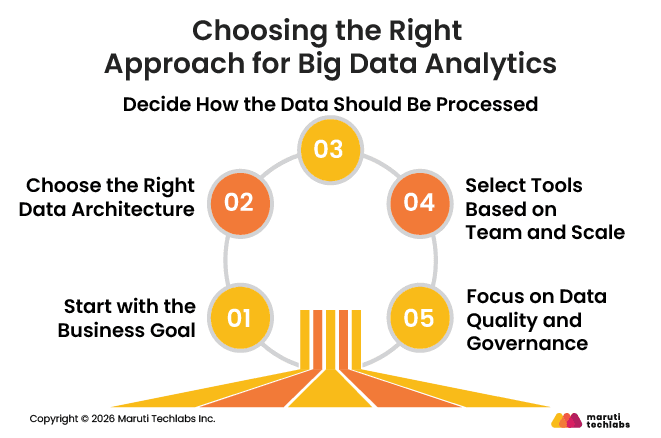
1. Start with the Business Goal
Before choosing any platform or analytics system, businesses should first understand what they want to achieve from the data. Different goals require different types of analytics.
- Descriptive Analytics: Used to understand past performance through reports and dashboards.
- Diagnostic Analytics: Helps businesses identify why a problem or trend happened.
- Predictive Analytics: Uses machine learning and historical data to predict future outcomes.
- Prescriptive Analytics: Suggests actions businesses can take based on analytics results.
2. Choose the Right Data Architecture
The type of data being used often decides the storage and analytics setup.
- Data Warehouses: Best for structured business data and reporting workloads.
- Data Lakes: Better for handling large amounts of raw and unstructured data.
- Data Lakehouses: Combine features of both data lakes and warehouses for mixed workloads.
3. Decide How the Data Should Be Processed
Some businesses work with historical datasets, while others need real-time insights from live systems.
- Batch Processing: Used for scheduled reporting and large historical datasets.
- Real-Time Processing: Used when businesses need live analytics from transactions, sensors, or customer activity.
4. Select Tools Based on Team and Scale
The tools a business chooses should match its technical skills, analytics maturity, and scalability requirements.
- BI and Reporting Tools: Platforms like Power BI and Tableau help teams create dashboards and reports.
- Advanced Analytics Platforms: Tools like Apache Spark, Python, and R are commonly used for machine learning and large-scale analytics.
- Cloud Platforms: Services like AWS, Azure, and Google Cloud help businesses scale analytics systems more easily.
5. Focus on Data Quality and Governance
Good analytics also depend on clean and reliable data. If the data is incomplete, outdated, or inconsistent, the insights will not be accurate.
Businesses should also have clear rules for data access, security, privacy, and compliance across their systems.
The Future of Structured and Unstructured Data in Big Data Analytics 2026
Big data analytics is moving toward combining structured and unstructured data instead of handling them separately. Businesses now rely on both transactional data and content like emails, videos, social media posts, and customer conversations to gain better insights.
Structured data will still be important for reports, dashboards, and business operations. But businesses are also using more unstructured data like customer conversations, videos, documents, and social media content for AI and advanced analytics.
Businesses are also changing how they store and manage data. Instead of using separate systems for different data types, many organizations are adopting lakehouse platforms that can handle structured, semi-structured, and unstructured data together.
AI technologies like Natural Language Processing (NLP), computer vision, and real-time analytics are making it easier to process large volumes of raw data. Businesses that can combine and analyze different data types effectively will have a stronger advantage in decision-making and automation.
Conclusion
Structured, unstructured, and semi-structured data all play an important role in modern big data analytics. Structured data helps businesses manage reporting, transactions, and operational processes, while unstructured data adds deeper context through emails, documents, videos, customer conversations, and social media content. Semi-structured data bridges the gap by offering flexibility along with some level of organization.
As enterprise data continues to grow, businesses can no longer rely on isolated systems and traditional analytics alone. Combining structured and unstructured data helps organizations build a more complete view of customers, operations, and business performance. This often involves using modern data platforms, integration pipelines, AI models, and advanced analytics techniques to process large and diverse datasets more effectively.
Businesses that can successfully connect and analyze different types of data will be in a better position to improve decision-making, automation, customer experience, and long-term business growth.
FAQs
1. What is the difference between structured and unstructured data?
Structured data is organized in fixed formats like tables with defined fields, making it easy to query and analyze. Unstructured data lacks a consistent format—such as text, images, or videos requiring advanced tools and AI techniques to interpret, store, and efficiently extract meaningful insights.
2. Which type of data is easier to analyze, structured or unstructured?
Structured data is easier to analyze because it follows a predefined schema, allowing straightforward use of SQL queries and dashboards. Unstructured data requires specialized analytics, such as natural language processing or image recognition, to identify context and extract insights, making it more complex and time-consuming to process.
3. What percentage of enterprise data is unstructured?
According to multiple industry reports, including IDC and Gartner, over 80% of enterprise data is unstructured. This includes emails, social media content, documents, and multimedia, representing a vast yet underutilized source of insights for strategic decision-making and personalized customer engagement across industries.
4. What tools are required to analyze unstructured data?
Unstructured data analysis relies on advanced tools and frameworks such as Apache Hadoop, Spark, Elasticsearch, data lakes, and AI-based methods like NLP, computer vision, and machine learning. These enable efficient, scalable storage, processing, and contextual analysis of large, complex, and diverse unstructured datasets.
5. How can organizations effectively combine structured and unstructured data?
Organizations can integrate both data types through data lakes, ETL pipelines, and semantic layers that merge relational and non-relational sources. Using AI-driven analytics platforms, they can correlate quantitative metrics with qualitative insights, delivering richer, context-aware intelligence for improved decision-making, customer experience, and operational efficiency.
How Maruti Techlabs Helped a Used Car Sales Platform Improve Profitability Forecasting
Maruti Techlabs helped a used car sales platform improve affiliate payment forecasting and reporting through a modern analytics solution. Our team migrated sales data from AWS to Snowflake, organized historical datasets, and developed an AutoML-powered profitability prediction model in Domo to support a new affiliate payment process.
The solution helped the client achieve 12–15% monthly savings, improve affiliate engagement, and enable faster partner payouts through more accurate forecasting and reporting.
The project also included reporting dashboards and analytics workflows that gave the client better visibility into affiliate performance and profitability trends. Similar approaches are part of our Data Visualization Services, where we help businesses transform complex datasets into clear and actionable insights.
Beyond predictive analytics and dashboard development, our team works with cloud platforms, BI tools, AI technologies, and modern data ecosystems to help businesses improve operational visibility, modernize reporting systems, and scale enterprise analytics capabilities.
You can explore our Data Analytics Services to learn how we help businesses modernize reporting, forecasting, and enterprise analytics systems.



